· 5 min read
Using Excel and Power Query for migrations
Migrations can be a tricky thing. Over the years I managed to do quite a few of them. Yet for some reason I always end up using some Excel skills to write reports. It doesn’t matter how good the migration tools or scripts are, there always seems to be a reason to write additional reports in Excel. So, it made sense to log and share some of my most used queries.
Excel to the rescue
The first trick is that it doesn’t matter what format the data is in. Excel can work with all sorts of formats. So common files we see I encounter a lot like CSV or TXT files that needs importing, or XML files that you want to map are all supported. There are some performance penalties when importing large XML files so you might want to work with the 64-bit version depending on the size of the data. But generally speaking, for your migration reporting Excel can work with most data I encountered so far. The only remark is that if you are working with localized versions of Excel or if you are using localization settings in Windows you might encounter that files use different separators (Dutch vs US settings differ in using ; or , as separators).
Basic Excel formulas
Obviously depending on how clean your data is you might need work it a little before it is usable, so the basic functions will come in handy:
=CONCATENATE("Text ", A2, " ", A3, " is ", A4, )to combine multiple cells or combine text and cells. See docs=LOWER(A2)converts everything to lowercase. See docs=UPPER(A2)converts everything to uppercase. See docs=SUBSTITUTE("this is a test", "test", "result")replaces the word test in our test string for the word result. See docs=LEFT("Demo time",4)returns the first for 4 characters starting left. See docs=RIGHT("Demo time",4)returns the last for 4 characters starting left. See docs
Combining functions
Besides the basic text formulas you can also combine different formulas for cases where one of them is not enough. You can combine the =LEFT, LEN (used to determine the length of something) and =RIGHT to remove a trailing / from a URL by using: =LEFT(A5,LEN(A5)-(RIGHT(A5)="/")). Or you can find the site relative URL from https://contoso.sharepoint.com/sites/demo using =RIGHT(A1,LEN(A1)-(FIND("/sites/", A1)-1)).
VLookup
A bit of a complex option is the VLOOKUP formula. It always takes me a bit of time to get it to work like I want, but it allows you to look up values in another range. It thus is a great way to translate a specific set of values or combine two tables. One of the most common cases I encounter is the requirement to translate a weird department number into a meaningful name. Let’s assume we have a table that contains the UserName and a Department code for a user. Lets say that we want to translate that Department code to a fancy looking display name.
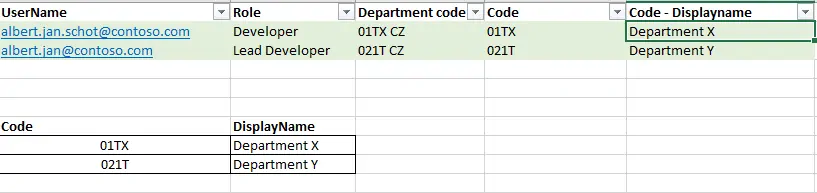
Step one would be to translate the department code into a format we can use, in our case we need the first 4 digits. Yet we can’t be sure its 4 digits, so instead of only picking that we will split the value by the space using =LEFT(C2, FIND(" ", C2)-1). Once we have the code we can use a VLOOKUP to find the result for it. I always create a dynamic range because that keeps your formulas readable. The VLOOKUP itself uses a lookup value, a range to work with and the result it should return based on the ID of the column. Breaking it down resulting in the following formula =VLOOKUP(D2,lookupsample,2,FALSE). You can use the same approach if you want to use a dropdown in your Excel file, the formula stays the same but you need to add some dropdown with data validation
Power Query
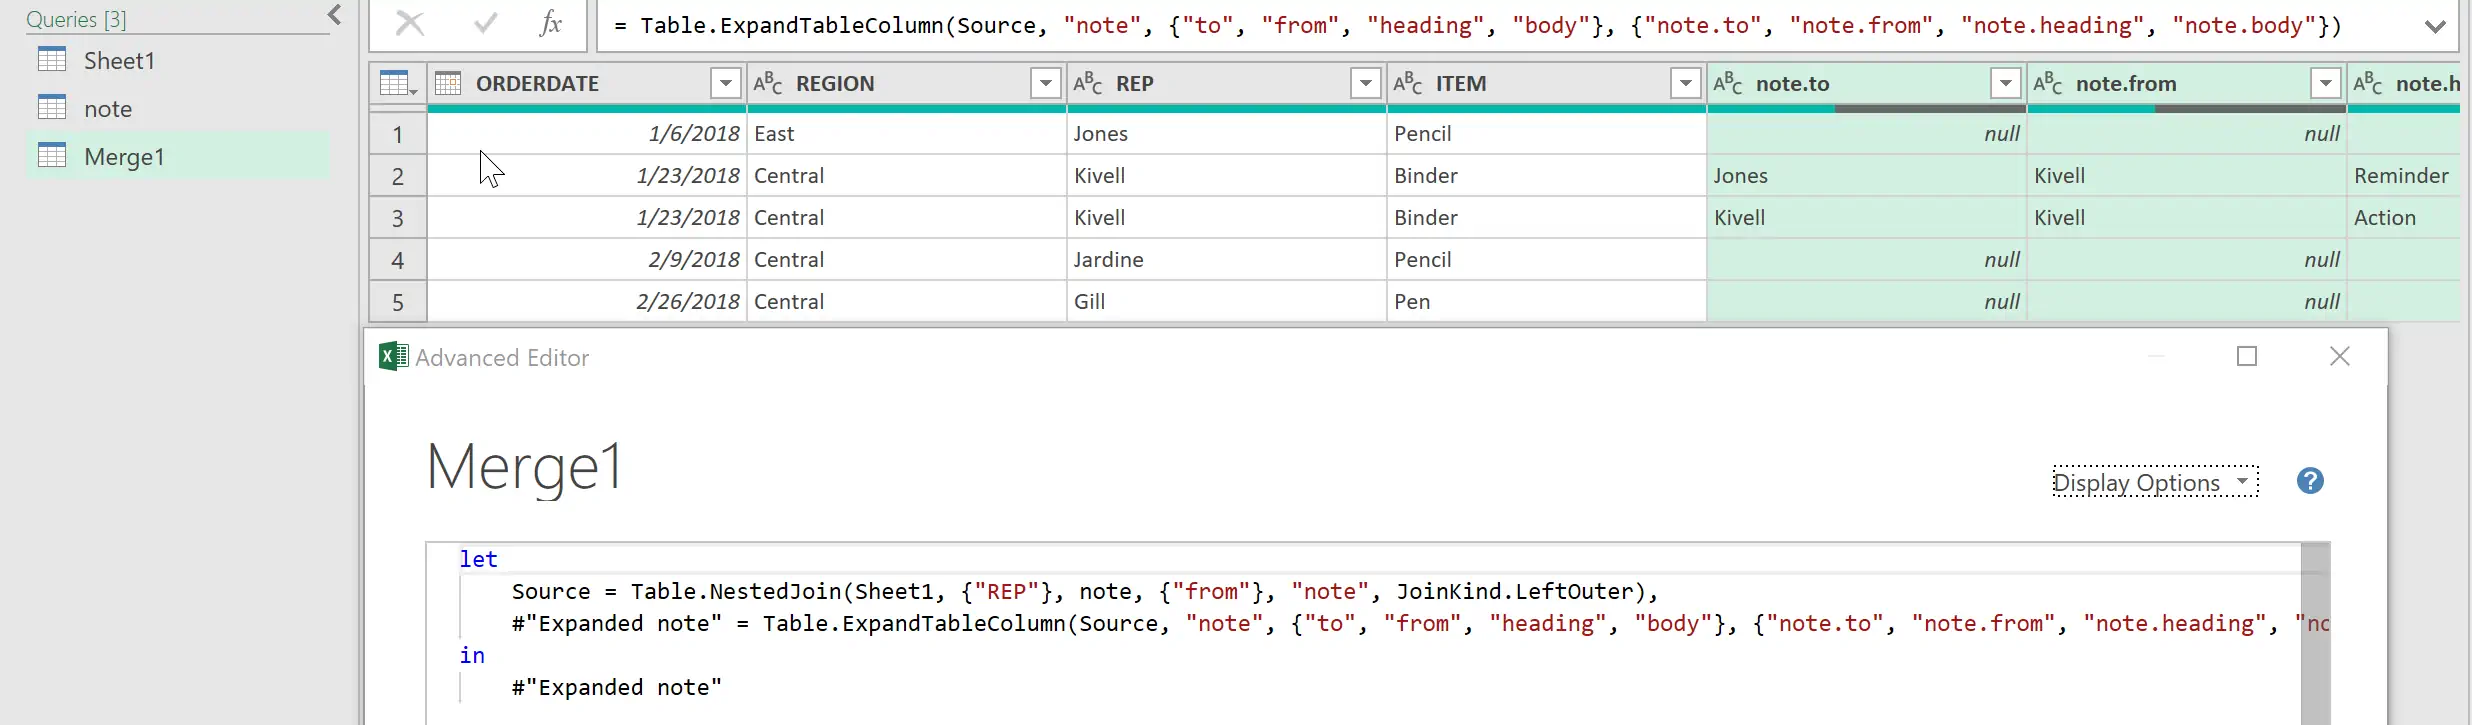
Another great option is working with Power Query. It is the solution for anything that starts to become a bit more complex on the data side of things. You can use it to combine different sources and it have more possibilities compared to just the VLOOKUP option in Excel. You can read all about the options on the Microsoft Support docs.
My most used scenario is to merge-, or compare data between tables. It starts with loading the data, something that is similar to Excel it self. You start Power Query using the Data - Get Data - Launch Power Query Editor. In the editor you can use new source to add new files. Once you have the files you need you can use new query to combine both sources of data into a new table. There are several options to combine sources. You can find some great explanations on how those combinations work on the merge query docs.
Now you can imagine that you can use those queries to combine two reports; files you should migrate and files you have migrated to generate reports of files that went missing during a migration by using the left- or right anti or inner option.
But I can write PowerShell
The reason I started working with Excel and Power Query for reporting cases was twofold. I botched up a PowerShell script and I ended up fixing it quicker with Excel compared to re-running the migration. Then I realized that I spend a lot of time tweaking scripts to output the reporting a customer wants, and in the end, requirements change throughout the project. Hence, I started with experimenting with Excel, and it turns out that with a few relatively simple queries you can combine existing data with the results of your migration; all you need is a single unique identifier to figure out what relates to what and your good. If you have a data dump that contains a unique filename and a report that tells you how your migration went containing that same unique filename you are good. A good enough reason for me to learn a bit more Excel.

Albert-Jan Schot
CTO, Microsoft MVP & FastTrack Recognized Solution Architect
I am Albert-Jan Schot, CTO at Blis Digital, Microsoft MVP, and FastTrack Recognized Solution Architect focused on Microsoft 365, Azure, and AI agents. I help teams turn complex Microsoft Cloud challenges into practical architecture decisions and shipped outcomes.
Zuid Holland, Netherlands